Detecting and remediating code execution risks is a key aspect of shipping secure applications, but several of these risks aren’t detected by SAST or DAST tools.
What do you mean by ‘code execution risks’?

We define code execution risks as risks in process, memory, network or file behavior of an application. There are numerous such risks that could lie in an application. Here are a handful of examples:
- Use of unsafe string APIs (unchecked buffer length versions of strcpy, strcat etc..)
- Use of deterministic random number generator calls such as rand()
- Use of unsafe IOCTLs
- Use of sensitive information (such as keys) in your environment variables
- Use of fork() without clearing out sensitive memory regions
Why monitor system calls?
The system call interface of your app is a high traffic area. Your app uses system calls to interact with the underlying kernel, and perform process, memory, network, file or other operations, with the kernel’s help. If your app is compiled (C/C++ ..), it invokes the system calls directly (using a library like glibc or equivalent). If your app is interpreted (Java, Node.js, Python …), the underlying interpreter is usually the one invoking the system calls.
Observing an application’s system call interface and detecting anomalies can help detect code execution risks. These risks can lie in the code that your team wrote or in the 3rd party code your developers checked in. In some cases, even if your team wrote perfect code and your dependencies are perfect, the interpreter you are using (such as Java or python) might be exhibiting these risks.
Unfortunately, from a security point of view, the attacker doesn’t really care if the issue is in your code or 3rd party code or in the interpreter. Any of these risks are likely to be exploited. So having a robust approach to observing your applications’ system and library call behavior, and detecting these risks (preferably before you deploy to prod) is highly important.
Won’t my DAST scanner catch these issues?
DAST scans do not detect these issues because they are not looking ‘inside’ your app. DAST scanners, such as OWASP ZAP, are great tools that allow you to scan the web interfaces and APIs your app is exposing, but they are looking at your application and probing it’s web/API interfaces ‘from the outside’. In order to detect code execution risks in your running applications, one needs an observability solution that looks ‘inside’ your app while it is running. To learn more, read the blog, “DAST & Observability: Made For Each Other“.
How do I monitor system calls and detect code execution risks?
There are several ways to monitor the system calls your application is invoking. Here are some examples:
- eBPF (Extended Berkeley Packet Filters)
- LD_PRELOAD
- good old strace
In order to detect code execution risks, one needs to do the following:
-
- Run the application
- Continuously monitor the system calls the application is invoking
<li”>Ingest these millions of lines of application event telemetry into a time series database
- Detect anomalies
- Provide a summary of the code execution risks along with actionable evidence such as stack traces.
How do I integrate detection of code execution risks in the DevSecOps pipeline?
One time detection of these risks in an app is interesting. But what’s more useful to engineering teams is if these risks are detected for every build & the results are compared across builds. So integration of all of these tasks #1-#5 as part of your CI pipeline is a great way to stay on top of code execution risks.
Key Learnings
Detecting and remediating code execution risks is a key aspect of shipping secure applications. Several of these risks aren’t detected by SAST or DAST tools. And apps are getting more granular (with microservices) and shipping at a faster pace (with DevOps), it is even more important to detect these before deploying your app to prod.
Next Steps to Begin Your Journey to Detect Code Execution Risks
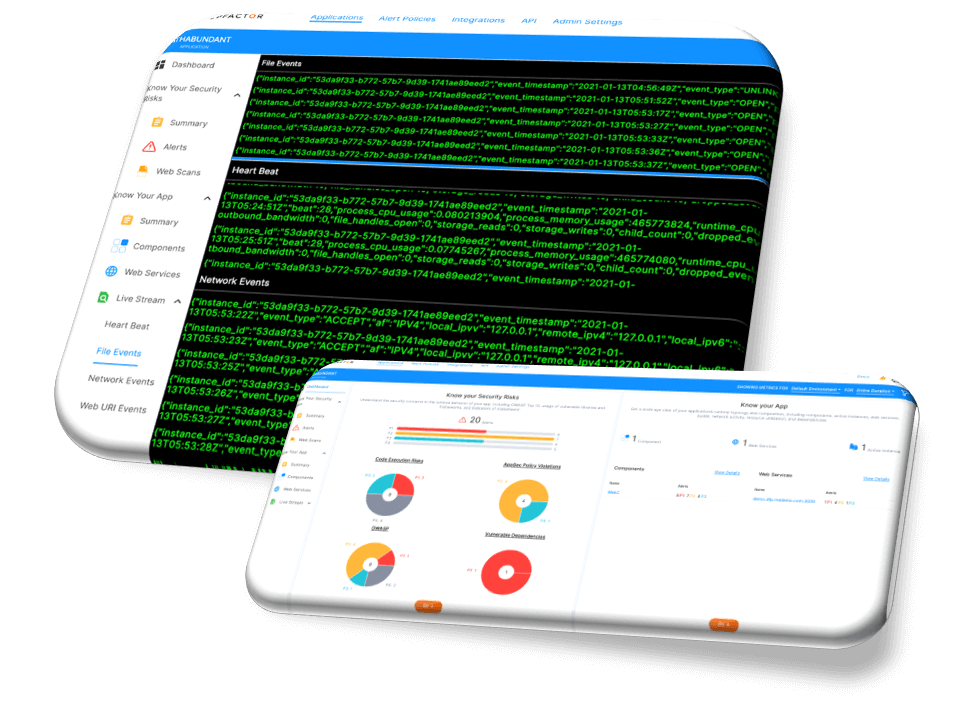
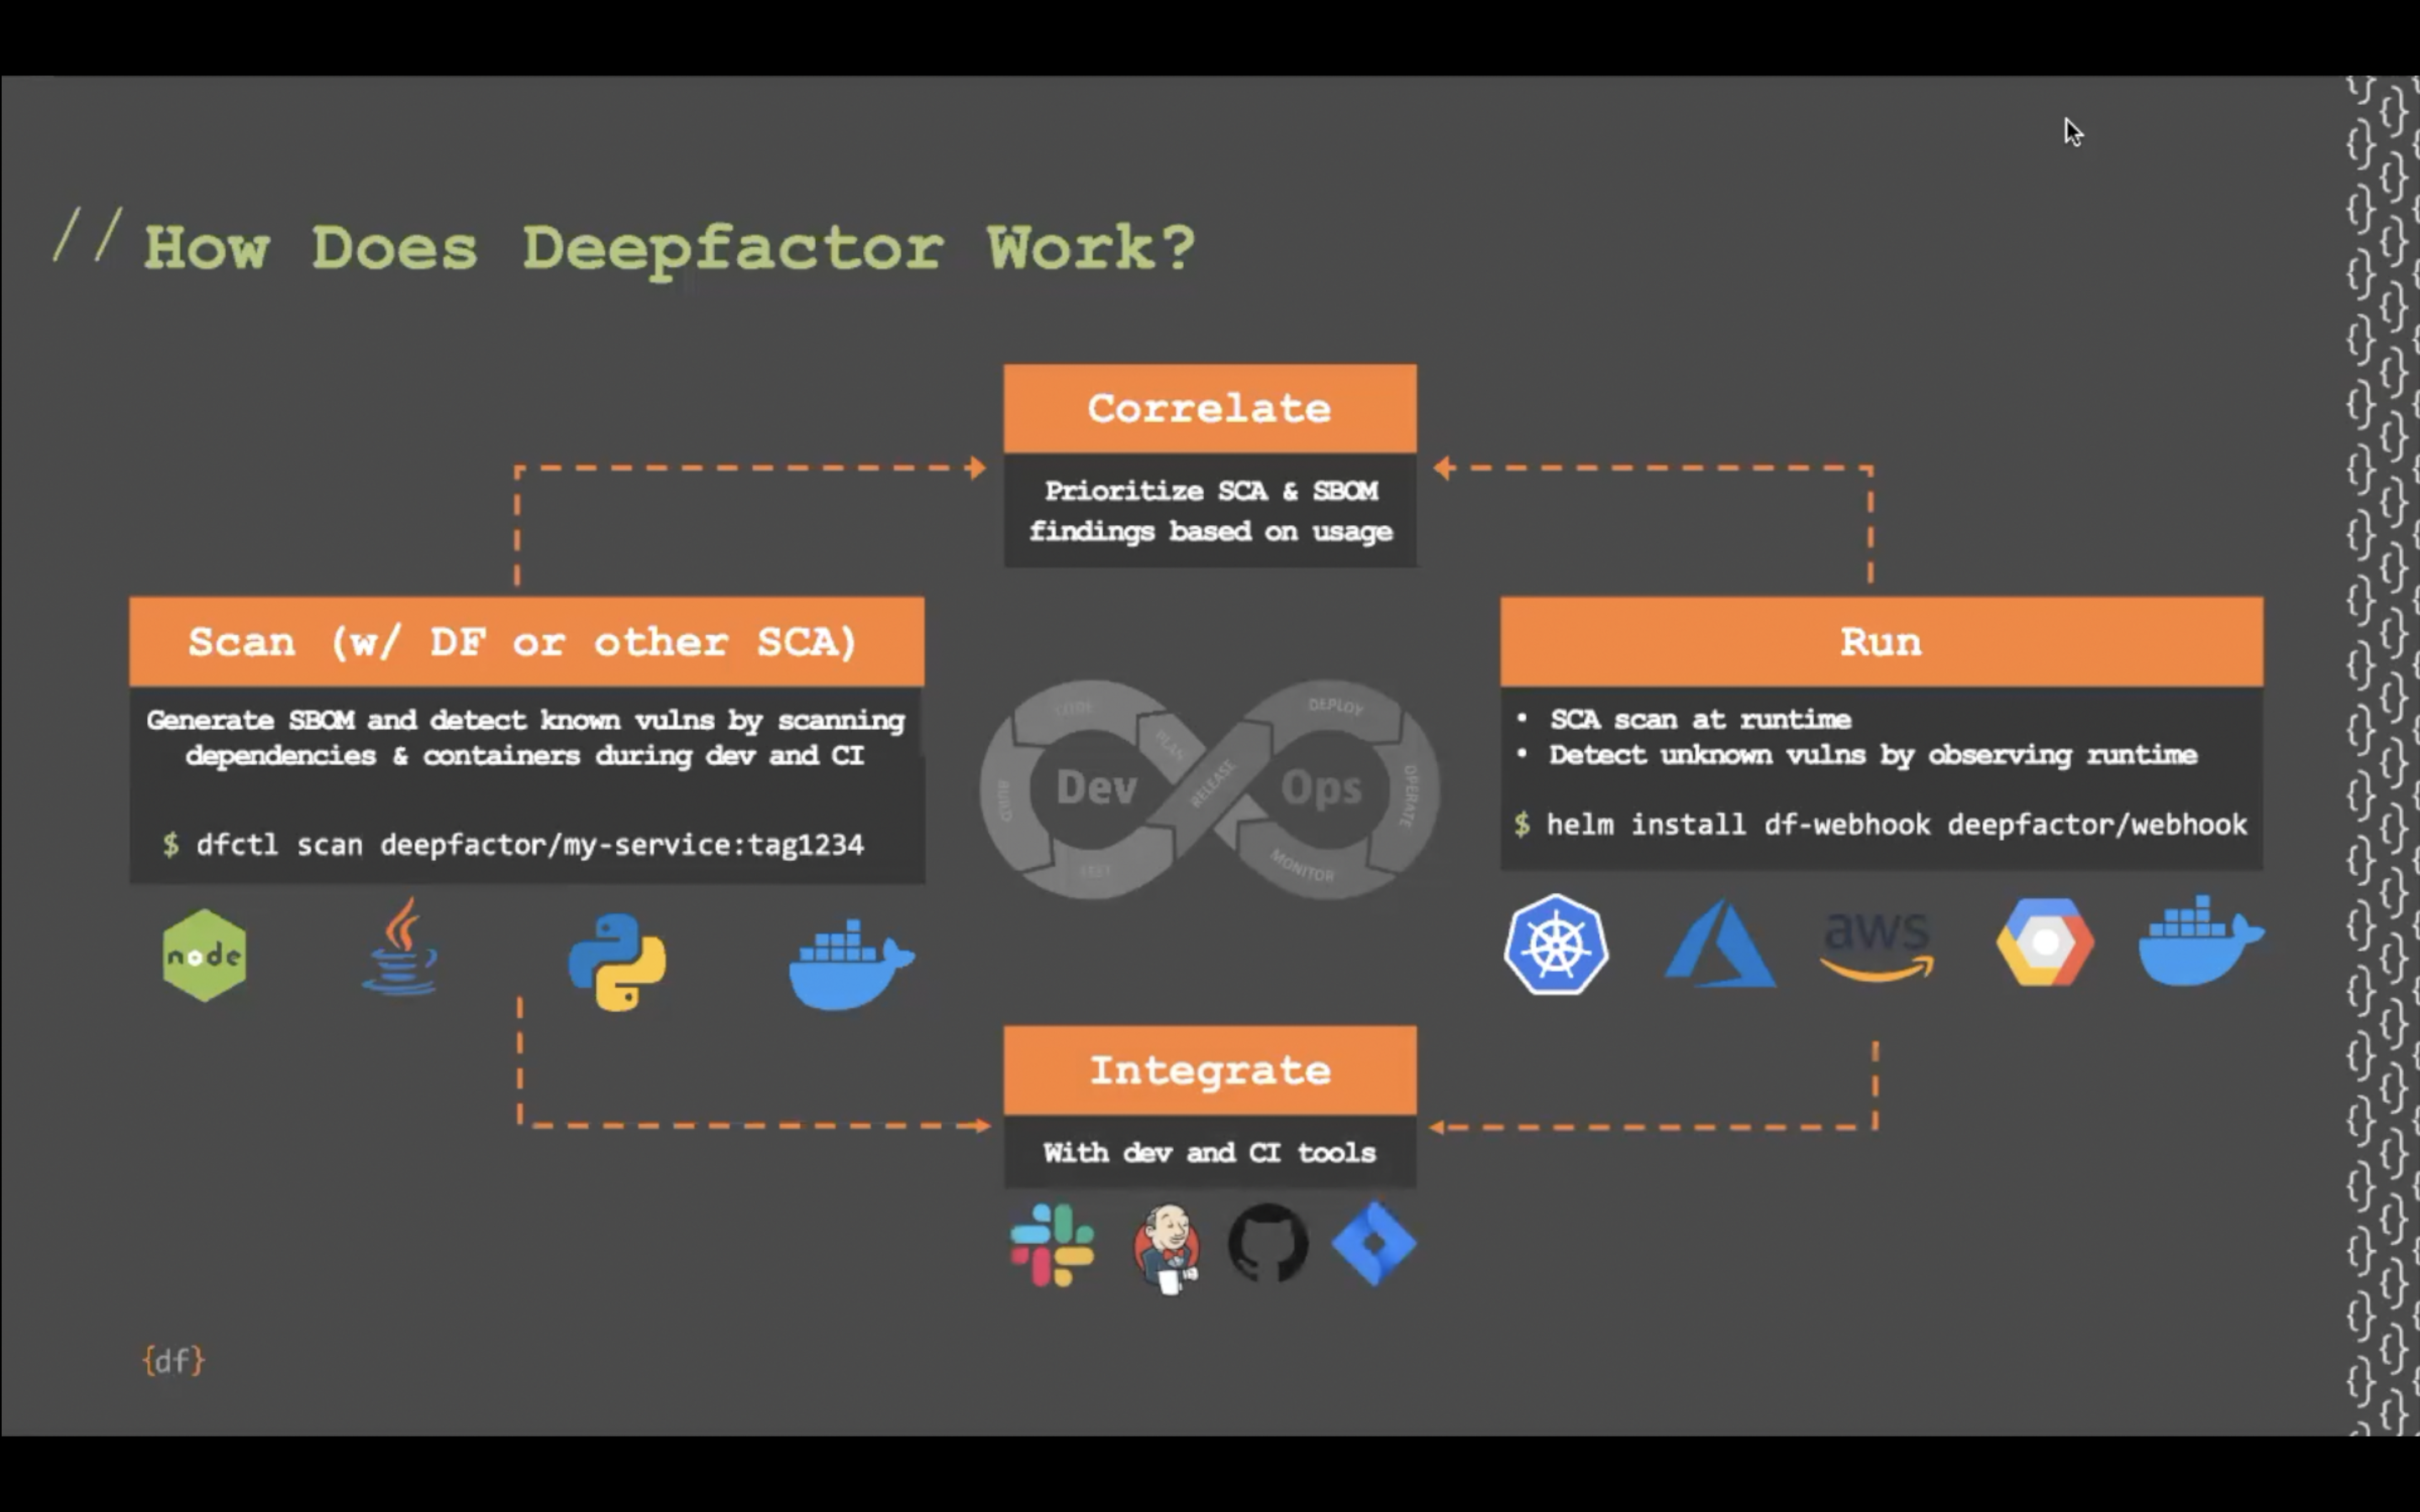
Continuous Observability tools like DeepFactor do all of these things for you, and provide a turnkey platform to detect code execution risks (as well as several other categories of risks) by >observing millions of live application telemetry events, detecting anomalies, augmenting insights with actionable evidence such as stack traces, and seamlessly integrating this into your CI platform.
With DeepFactor, you no longer need to choose between shipping fast versus secure to production—DeepFactor empowers you to deliver both with confidence. Designed for today’s modern apps, DeepFactor is the industry’s first Continuous Observability platform to fill the void between static code scanning (SAST/SCA/Container scanning tools) on the left and operator tools (Container/Kubernetes security and vulnerability scanning tools) on the right.
You can use DeepFactor for free or try our sandbox demo environment and see for yourself how easy it is to find and triage RUNTIME Security, Privacy, and Compliance risks within the DevOps pipeline.
BRING ANY WORKLOAD ¦ LANGUAGE AGNOSTIC ¦ NO CODE CHANGES ¦ ONE COMMAND


