Types of events #
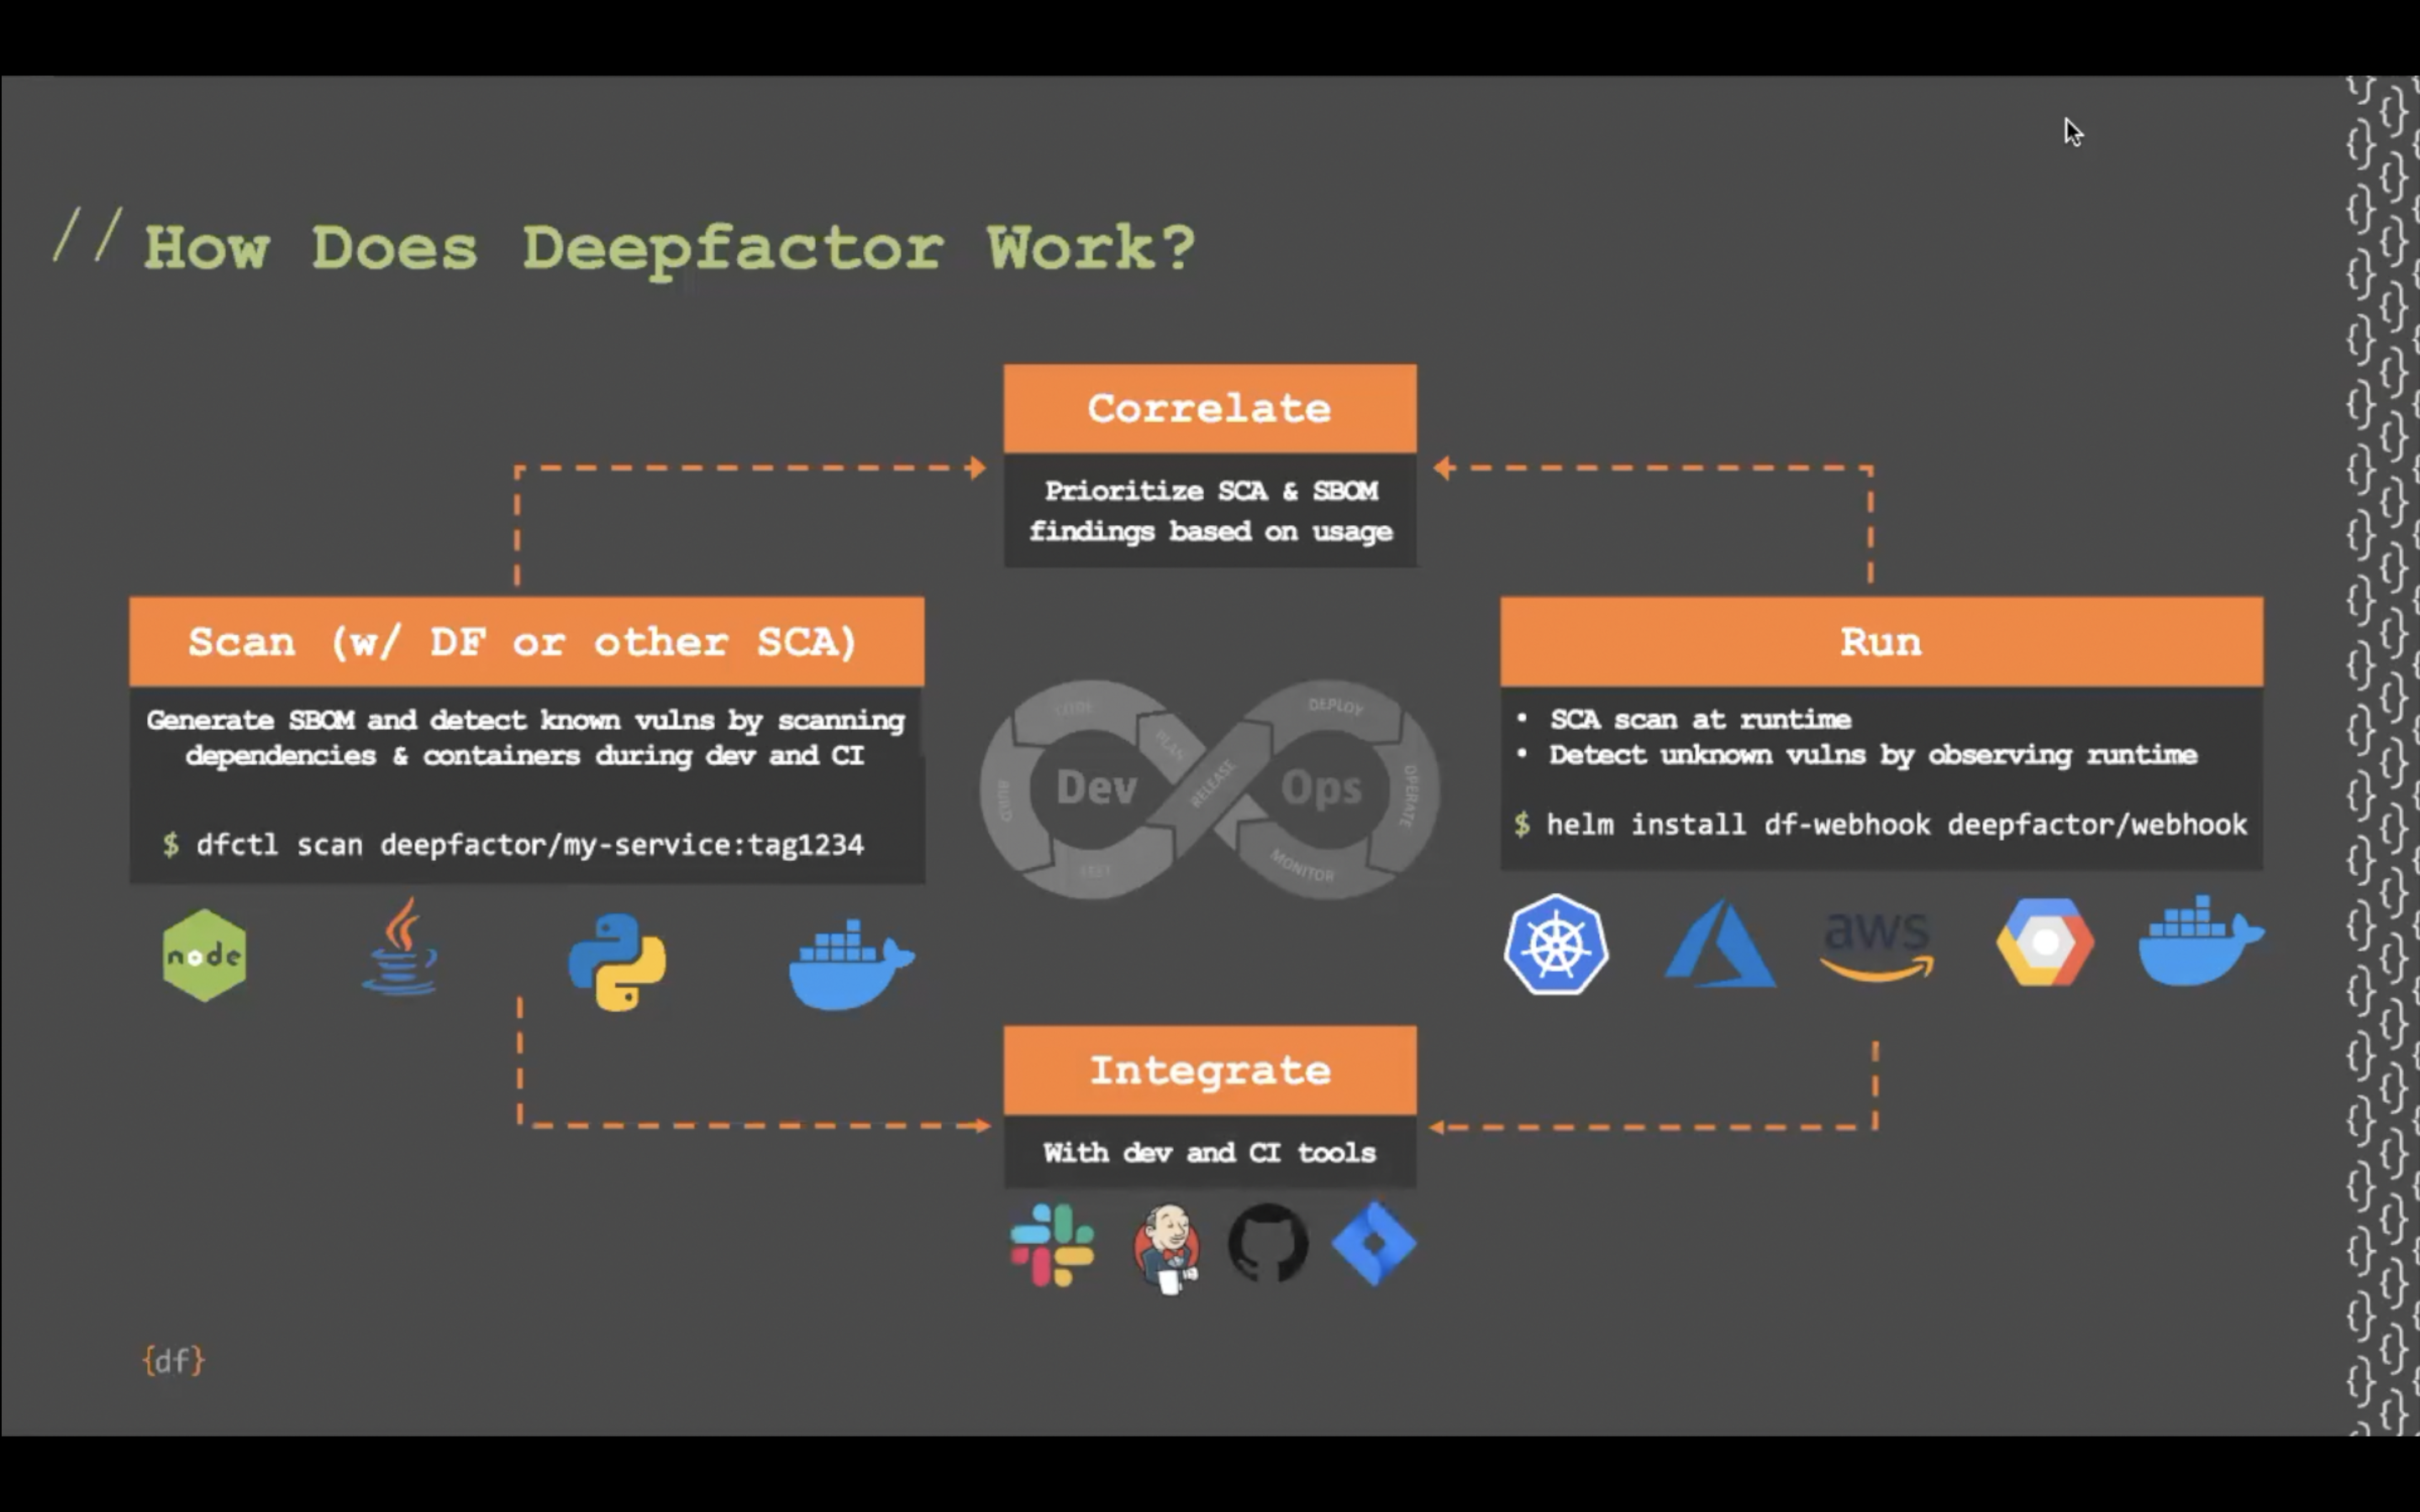
Deepfactor intercepts application behavior and environmental context to provide security insights. To this end, the high-level telemetry categories listed below are sent between the application being observed and the Deepfactor management portal:
- Telemetry sent once for each process
- Telemetry sent once for each environment (container/VM)
- Telemetry sent once per API invocation
- Additional telemetry sent for web applications
- Telemetry sent periodically (heartbeat events)
- Language specific telemetry events
All telemetry sent from an application to the Deepfactor management portal is encrypted using TLS 1.3, via certificates installed by the customer (or using a default self-signed certificate generated during product installation).
The telemetry data described in the following sections is stored in the Deepfactor management portal temporarily and is used by the management portal to create alerts based on application behavior and package vulnerabilities, subject to the alert policies chosen by the administrator. Deepfactor will send the telemetry described in this document to the management portal regardless of the alert policy currently in place for a given application; the management portal may choose to ignore certain fields if that data is not applicable to a given application.
Telemetry sent once for each process #
Deepfactor sends up to two telemetry events per process launch/termination:
- Process start event
- Process stop/termination event
The process start event contains the following information:
- Host information (system host name, uptime, number and type of CPUs)
- OS/distribution information (OS name/distribution and version)
- CSP information (CSP type (Amazon/Azure/GCP, for example)
- Container runtime (docker or other)
- Process information (memory maps, process ID, process parent ID, UID, GID)
- Kubernetes pod name and namespace
- Environment variables and their values
The process termination event contains the following information:
- Process exit code
Note: a process termination event is not guaranteed to be sent for each process (for example, if the process crashes before Deepfactor can send the telemetry event, no termination event will be recorded)
Telemetry sent once for each environment (container/VM) #
Deepfactor creates a “host environment telemetry event” for each new pod/container/VM. This event contains the following:
- List of OS packages installed in the container/VM (package name, version, source)
Deepfactor will also send the package license information for each package as part of this event if license information is available.
Telemetry sent once per API invocation #
For events generated as the result of the application invoking an observed API, various telemetry data is sent. The following subsections break down the data that is sent for each scenario.
Note: All API invocation-related telemetry events contain stack trace frame data, which can be augmented with symbols in the Deepfactor management portal to provide contextual information to assist developers in resolving bugs/issues (such as line number and source file name).
Telemetry Related to File Operations #
File events contain the following information:
- Operation/API name/type (for example, “open”, “read”, “write”, “unlink”, “truncate”)
- Absolute pathname(s) being operated upon
- Mode/flag bits provided to the api (for open and create operations)
Telemetry Related to Network Operations #
Network events contain the following information:
- Event type (“bind”, “connect”, “accept” or “DNS”)
- Address family
- Port and address information (remote and local port and address)
- For DNS, a list of FQDNs being resolved
Telemetry Related to Identity Change Operations #
Identity change events contain the following information:
- Type of identity change (for example, “setuid”, “setgid”, “setegid”, “seteuid”, etc)
- Numeric 2-tuple containing the “from” and “to” identities
Telemetry Related to Process Operations #
Process related events convey information about new processes being launched and contain the following information:
- Event type (exec, spawn, clone, etc)
- Pathname of the launched executable
- Command line arguments
Telemetry Related to Library (Dependency) Operations #
Dependency information events provide information about shared libraries (.so files) and other dependencies (Java .jar/.zip files, for example) loaded by the process and contain the following:
- Full pathname of the dependency being loaded
- SHA256 sum of the dependency binary
- Contextual information about dependency parent-child relationships (to preserve nested dependency hierarchy)
- Language (eg Java or C, if known)
- Dependency version if known
Telemetry Related to Web Applications #
Web application telemetry events are sent in the following cases:
- When Deepfactor detects a new Web application (eg, an application that has opened a listening socket and has received one or more HTTP-style transaction on that socket), the following information is sent
– L7 protocol (for example “HTTP/1.0”)
– Address family
– Remote and local socket and port information - When Deepfactor detects a new URI request on a previously observed web application, the following information is sent
– HTTP method (GET, POST, etc)
– URI (eg, “/myapp/api/v1/foo?param1=bar”)
– Local listening port corresponding to a previously discovered web application - When Deepfactor detects an authorization/bearer token used to authenticate to a web application, the following information is sent
– Authorization type (bearer token)
– The bearer token’s value
– Local listening port corresponding to a previously discovered web application
Telemetry Sent Periodically #
Deepfactor sends periodic “heartbeat” telemetry events that contain the following information:
- List of file descriptors that are either currently open or have been opened and subsequently closed since the previous heartbeat event
- For files, the path of the file descriptor is included
- For sockets, any known local and remote port/address information is included
- Process memory and CPU usage
- Memory and CPU used by Deepfactor on behalf of the process
- Number of threads created and fork operations performed since the previous heartbeat event
Other API Related / Language Specific Telemetry Events #
On occasion, Deepfactor may send additional telemetry events that do not fit into one of the previous categories. These include:
- Java method usage tracing telemetry, which includes the class name whose execution was observed during runtime.
Size of events #
The following table provides an approximate size of the raw telemetry data for a given event. Since telemetry events will contain data of various lengths (pathnames, URIs, etc), the following should only be used as a rough estimate as a customer’s specific telemetry events may be smaller or larger than these estimates.
When using these sizes to estimate the approximate amount of network traffic a particular application will generate, make sure to remember that these size estimates do not include network overhead due to TLS handshaking, TCP header overhead, or response messages from the Deepfactor management portal. For a sufficiently long-running application, this overhead should tend toward a small percentage of the overall traffic.
| Event Type | When / How often sent | Approximate size (bytes) |
|---|---|---|
| Component Start | Once per process launched | 4000 |
| Component Exit | Once per process exit | 200 |
| Host Environment | Once per container/VM. Consists of a list of installed OS components. | 40000 (can vary greatly based on the number of OS packages installed) |
| Package Info | Once per .so library loaded by a process | 400 |
| API | Once per observed API not associated with another type of alert in this table | 700 |
| Heartbeat | Once per process every 10 seconds | 500 |
| Network | Once per incoming connection, outgoing connection, or DNS lookup | 2500 |
| Dependency Info | Once per dependency loaded | 350 |
| Memory Warning | Every time an unsafe memory operation occurs (up to one per minute per type of warning) | 197 |
| File | Once per file operation (open, rename, delete, etc) | 1800 |
| Webapp Registration | Once per new webapp (socket listening and associated HTTP transaction noticed) | 300 |
| Webapp URI Discovery | Once per served URI discovered in an observed application | Minimum 200 (total size depends on URI length) |
| Process | Once per new process launched | 400 |
To give an idea as to how many of each of these events may be generated, the following is an example from a simple Java spring boot app launch and 5 URI requests from a client to the app’s served content. The application was then left idle for approximately 30 minutes. The application generated 743 telemetry events during the test period, sending a total of 659081 bytes (659.081 KB) of telemetry data (not including TCP/TLS network overhead).
Event count and size summary:
  Component Start Event: count=3, average size=4263, total size=12789
  Component Exit Event: count=2, average size=228, total size=456
  Host Environment Event: count=3, average size=38060, total size=114180
  Package Info Event: count=48, average size=349, total size=16785
  API Event: count=8, average size=739, total size=5918
  Heartbeat Event: count=248, average size=484, total size=120138
  Network Event: count=9, average size=2590, total size=23310
  Dependency Info Event: count=103, average size=376, total size=38764
  Memory Warning Event: count=197, average size=446, total size=87997
  File Event: count=120, average size=1816, total size=218009
  Webapp Register Event: count=2, average size=313, total size=627

