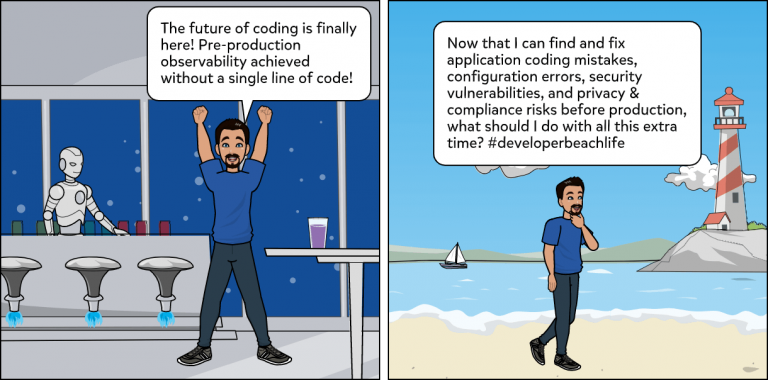
Hi everyone, Mike Larkin here. I’m the CTO and co-founder of DeepFactor. At DeepFactor, we’ve developed a new way of observing what your applications are doing while they are running. We’re focusing on giving you insights into your applications’ behavior before you deploy them to production. I’m writing this blog to share my thoughts on observability and why we (developers) should care about it.
Why is pre-production observability important?
At DeepFactor, we’re laser-focused on helping you find and fix application coding mistakes, configuration errors, security vulnerabilities, and privacy & compliance risks before they have a chance to bite you after deploying them live. You might be saying, “But Mike, tools like this exist today…”. And for production environments, I’d agree. Pen test tools and services, and performance monitoring tools like AppDynamics certainly fit that bill. I’d also be willing to concede that you might catch certain issues during build-time by using SAST & SCA tools. But, there is a blind spot that occurs after the build and before you go live.
Observability designed for developers.
My firm belief is that developers are in the best position to define an application’s behavior; after all, they developed the application in the first place! But as developers, we are living in an extremely fast-paced world now made even faster with DevOps and thus no company can develop every single component of their application. As developers, we are all continually improving our “npm-fu” and “github-fu” (importing libraries and frameworks without really knowing what we are pulling in) to meet increasingly aggressive deadlines. What if my code is “totally perfect and bug free” but I’ve pulled in a component that isn’t? Or, what if I have pulled in a component that itself has no errors but in turn imports a tertiary dependency that does have vulnerabilities?
Certainly, products exist to attempt to detect these kinds of dependency-based issues. Indeed, GitHub and GitLab have introduced dependent module vulnerability scanning services as part of their enterprise offerings. But these checks are performed at the source code checkin time; what happens if your code is dynamically importing something from a container’s base image or from the base operating system?
This blind spot is a serious problem – observing an application’s behavior at runtime and ensuring it meets a baseline set of rules for “sane” application behavior is especially important. You do not want those bad behaviors to propagate to production!
Deep Passive Observability™ – observe your app without a single line of code!
When we were starting DeepFactor, Kiran (my co-founder) asked me, “Mike, could you develop a technology where someone could add one line of code to their application and just “get observability?”. My response was, “I think we can do that without needing to add any code”. And thus, the seed idea for our Deep Passive Observability™ technology was born.
I’ve always been a believer in behavioral-based approaches to solidifying security and optimizing performance. Capabilities-based frameworks like SElinux and AppArmor tried to help the developer place boundaries around application behavior, but brought along their own baggage (from configuration headaches, to dealing with “why is this app not working?” to realizing “ah crap, SElinux is blocking something”). Newer ideas like OpenBSD’s pledge/unveil are much better but are not widely available outside OpenBSD and might not be usable for COTS software where you’re deploying a binary package that hasn’t been pledged/unveiled. When Kiran asked me the question posed above, I started to think about how we could revolutionize observing and enforcing behavior, while leaving the baggage of previous frameworks behind.
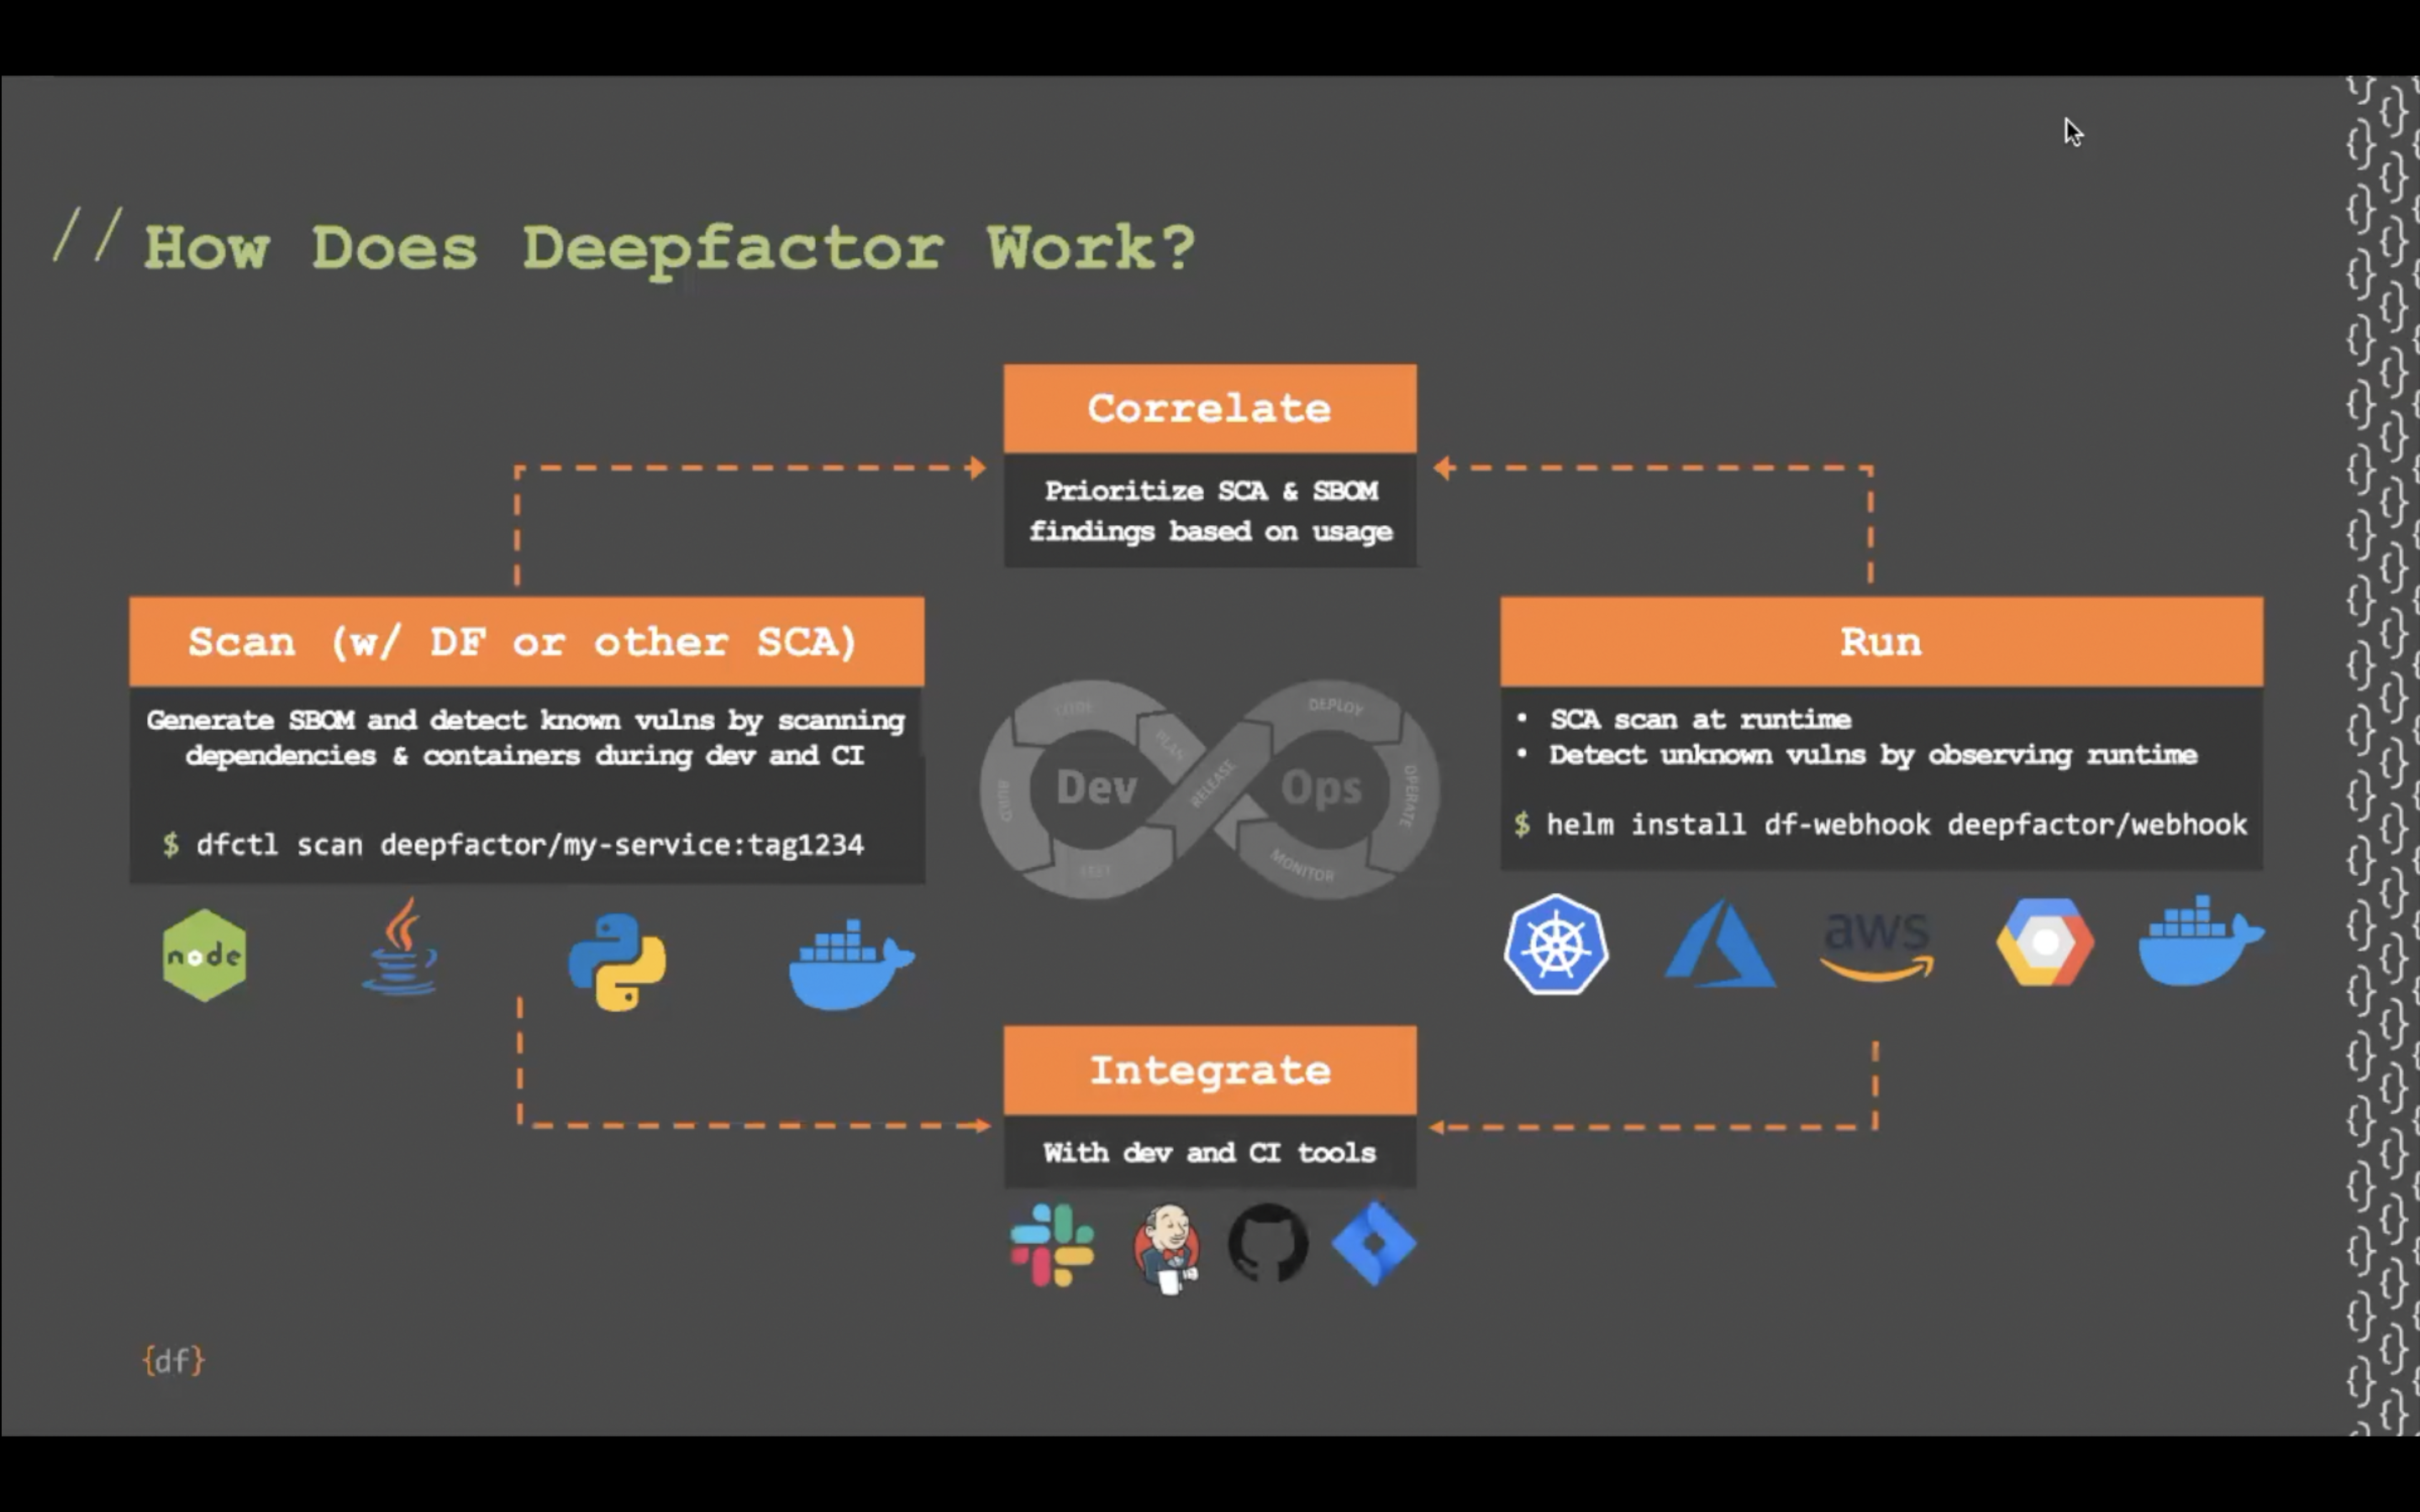
To this end, we’ve spent the last year developing our observability engine. This is a dynamically loaded library that intercepts over 175 library calls and sends behavioral information to our management portal. The information we collect varies based on what call is being intercepted, but a few examples might include the following:
- Files opened, created, read from, or written to, and the amount of I/O to each
- Network socket operations – outbound connections, inbound connections, DNS requests, and the amount of I/O to each socket
- Suspicious API usage – unsafe string/random number APIs
- Web service operations – is this application opening an HTTP listening socket, and if so, what URIs is it serving?
- What libraries, subcomponents, or frameworks are being loaded by the application?
- … etc …
This observability engine lives inside the application itself, requires no code changes, and is programming language agnostic. Being inside the application allows us to observe behaviors with more semantic knowledge than other techniques (sidecars, eBPF programs, etc).
Our runtime observability engine can be dropped into a Kubernetes (K8s) environment, a non-K8s containerized environment, as well as a legacy environment (bare metal or plain VM) with just two cut-paste commands. We’ve developed a “stupid simple” way to “get observability without a single line of code”.
Both Kiran and I are ecstatic about the number of developers who are using DeepFactor today to release code faster, with confidence. You can use it for free as well – register here and start immediately.
If you’re interested in learning more, please check out our website – we are always looking for new proof points and customers!
Use DeepFactor for FREE right now!
